← Back
Improving hurricane forecasting and emergency management

Warmer oceans tend to lead to stronger storms, and Hurricane Dorian, the first major hurricane of the 2019 season, which hit the Bahamas as a Category 5 storm on September 1st, 2019, seemed destined to prove this point. With the 2019 hurricane season well underway, here’s a closer look at how European satellites from the Copernicus program, along with a new Franco-Chinese mission called CFOSAT, promise to improve hurricane forecasting – as well as optimize post-hurricane emergency management measures.
European Sentinel satellites measure ever stronger winds
Thanks to the ESA initiative toward the space-borne monitoring of Tropical Cyclones, the Satellite Hurricane Observation Campaign (SHOC) consists in a joint effort between the Sentinel-1 mission planning team, IFREMER and CLS, to provide extreme wind observations from satellite-borne SAR (synthetic aperture radar). Once an alert is raised, the acquisition plan of both Sentinel-1 A and B missions is modified on short notice to capture the cyclonic event over the oceans before landfall including open ocean and coastal areas.
In the case of Dorian, three images from European Sentinel satellites coincided perfectly with the hurricane trajectory, making it possible for experts at CLS and Ifremer to estimate maximum ocean surface sustained wind speeds above 60 m/s on August 30th before Dorian reached the Bahamas. In addition, Canadian satellite RadarSat-2 imagery was made available on September 1st, with support from public funds* received in the framework of the VIGISAT project managed by “Groupement Bretagne Télédétection” (GIS BreTel – Brittany Remote Sensing). On September 1st, maximum ocean surface sustained wind speeds reached more than 80m/s as Dorian approached the Bahamas.
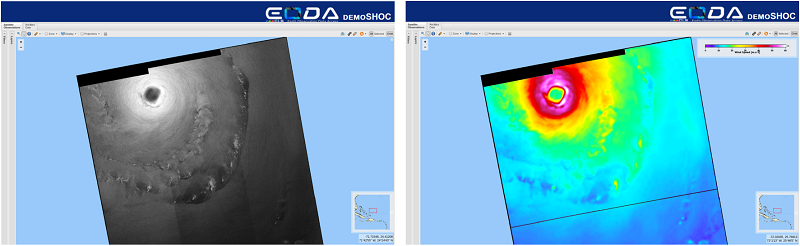
Sentinel-1A image acquired over Dorian on 30/08/19 at 22:46 UTC with SAR image and ocean sea surface wind speed map estimated from the SAR product. The algorithm used is described in Mouche et al., 2019.
CFOSAT to provide new understanding of wave strength and direction along a hurricane’s track
In parallel, a new Franco-Chinese satellite mission called CFOSAT, dedicated to monitoring ocean surface winds and waves, provided new insight into sea state along the hurricane track. One of the two main instruments onboard, the French radar SWIM (Surface Wave Investigation and Monitoring) determines the direction, height and wavelength of surface waves.
CLS is part of the French team that ensures data quality for SWIM, along with CNES, Ifremer, Météo France and LATMOS. Raw data from SWIM will be soon currently available via the AVISO website and highly processed data will soon be available for the scientific community at large from the Copernicus Marine Environment Monitoring Service (CMEMS).
In the case of Dorian, wave spectral parameters (direction, wavelength and height) are calculated on the full and partitioned spectrum. Those parameters can be represented by arrows. On the below figure the showed spectrum has been calculated on one box (70 x 90 km) along the track on September 3, and the parameters are plotted between August 30 and September 3. It shows how the off nadir information matches the nadir wave height and completes it with a direction and wavelength, apart from the central track, following well the position and intensity of the hurricane.
Along-track wave measurements from SWIM acquired at different moments along hurricane Dorian’s tracks (passes 94 (08/30), 139 (09/01), 169 (09/01) and 216 (09/03)) superimposed with the amplitude of the ECMWF wave model. The significant wave height in meters is given along-track by the instrument nadir beam, behaving as a classical altimeter (long lines) and the off nadir arrows indicate the height (color), direction and wavelength (direction and size of the arrows) of wave measurements obtained with spectral analysis calculated on both sides of the track. The increasing strength of the tropical cyclone can be seen through the increasing wave height. The satellite measurements bring precision when compared to the signal predicted by the model. Credits CNES/CLS.
Altimetry satellites to measure wave heights
CLS also contributes to maps of instantaneous Significant Wave Height, produced within the Copernicus Marine Environment Monitoring Service (CMEMS). This Level 4 gridded wave product (see below) merges along-track (level 3, also distributed) measurements from 5 altimeters (Jason-3, Sentinel-3A and 3B, Cryosat-2 and SARAL/AltiKa) to deliver an estimate of the wave height field in Near-Real-Time.
This below figure shows the daily evolution of the wave field as the Hurricane Dorian hits northwestern Bahamas and drifts West towards Florida. The daily evolution highlights the development and propagation of extreme wave heights, following the intensification of the hurricane. These data are fed into wave models on an operational basis, and are used by national meteorological agencies, such as Météo France, to improve tropical cyclone prediction.
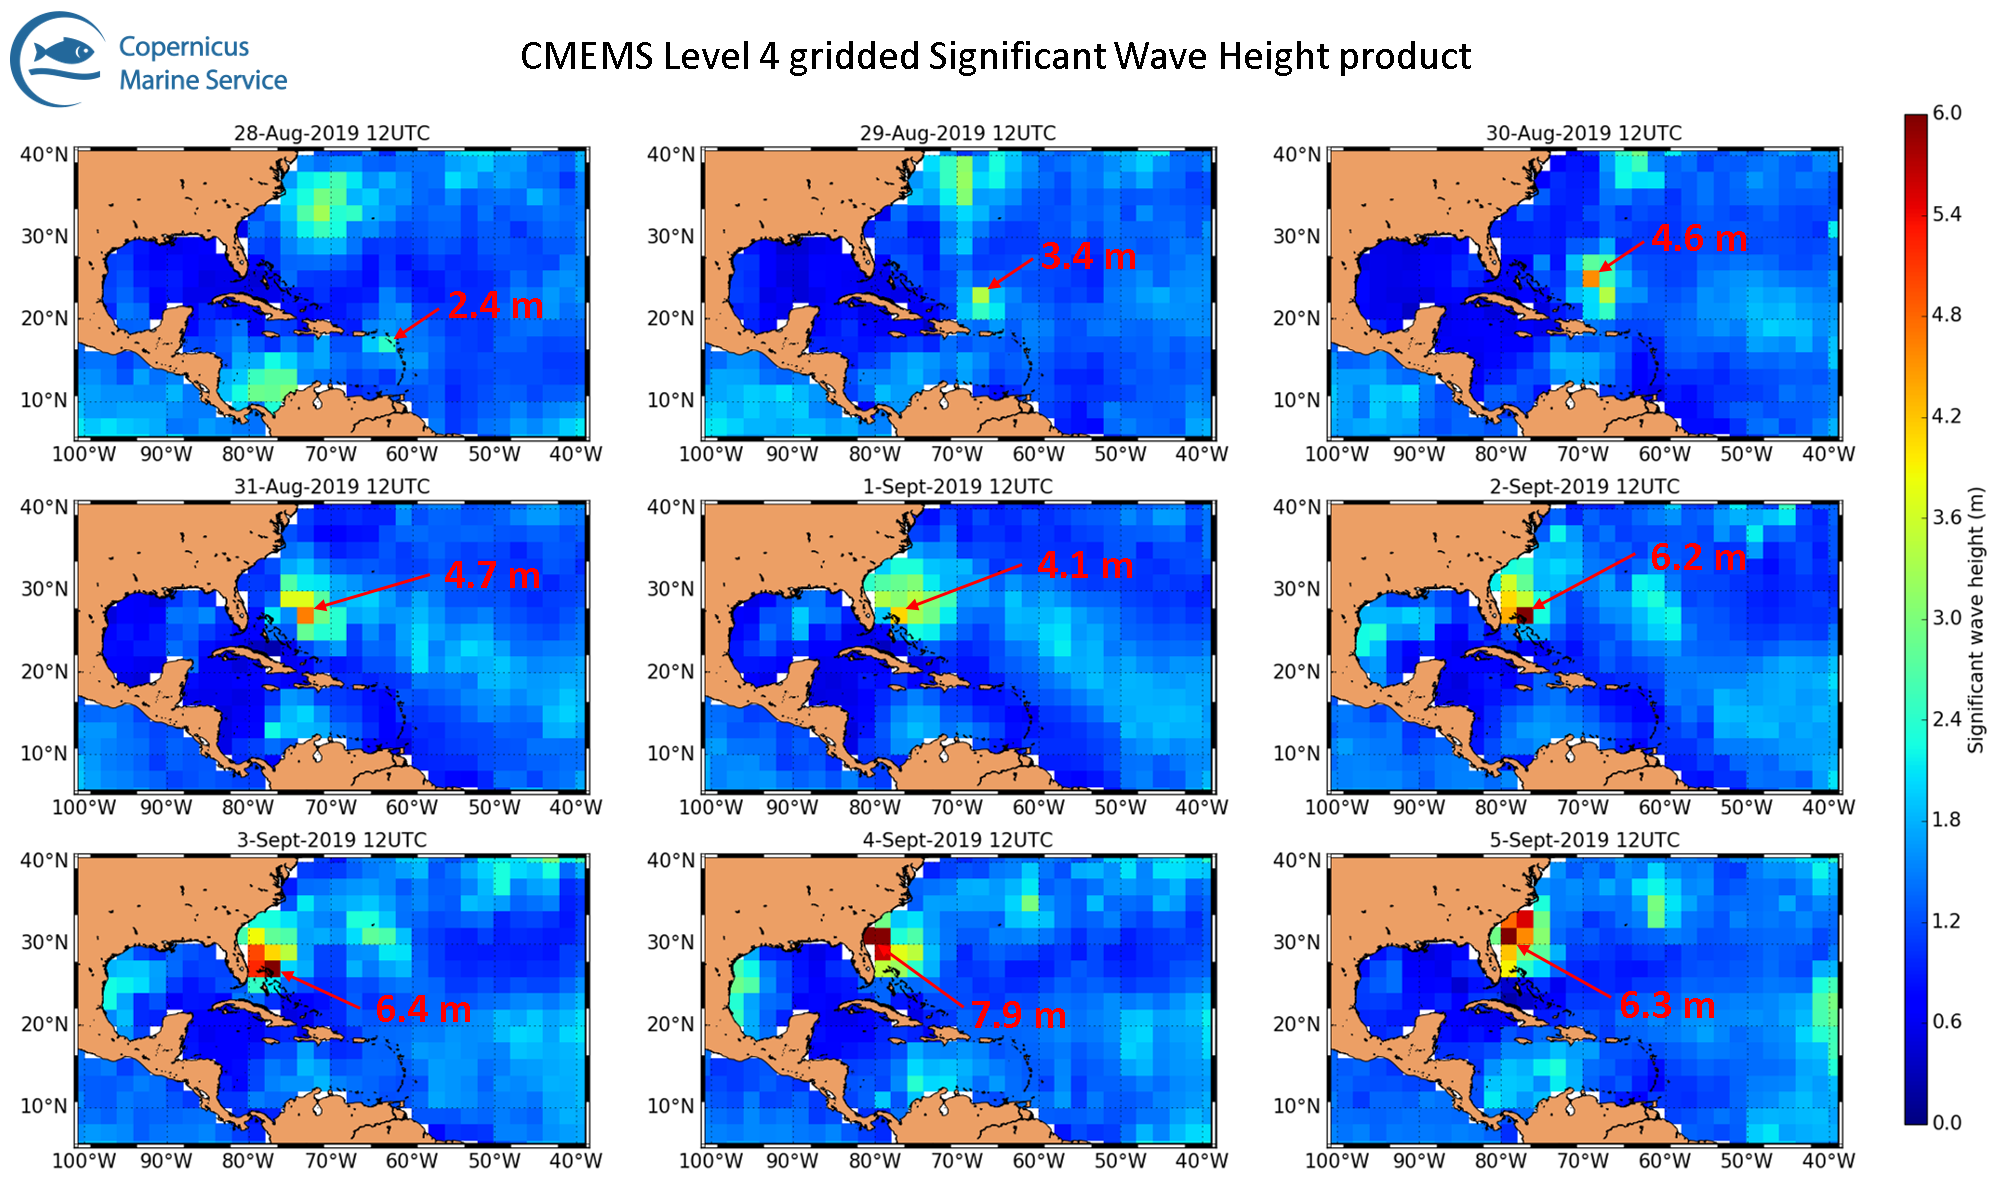
Credits European Copernicus Marine Service. Product WAVE_GLO_WAV_L4_SWH_NRT_OBSERVATIONS_014_003
Copernicus Emergency Management Service (Rapid Mapping) to support disaster recovery
Hurricane Dorian first hit the Bahamas as a Category 5 storm with winds reaching nearly 300 km/h and it dumped nearly a meter (91.4 cm) of rain on the Islands by Wednesday, September 4th. Copernicus Emergency Management Service (EMS) – RAPID MAPPING was activated to help local authorities on the ground assessing the geographical extent of the event and the level of damages on assets. CLS Group subsidiary, SIRS, and its partners provided first estimate products as well as grading maps over the affected areas thanks to the analysis of Earth Observation satellite images on September 7th. The maps produced over areas of interest representing nearly 6500 km2 in Northern Bahamas pointed out only 289 ha of flooded areas but quite a lot of damages on assets (8,415 buildings destroyed or damaged, potentially at least, 86 road blocks and 620 port infrastructure and piers affected).
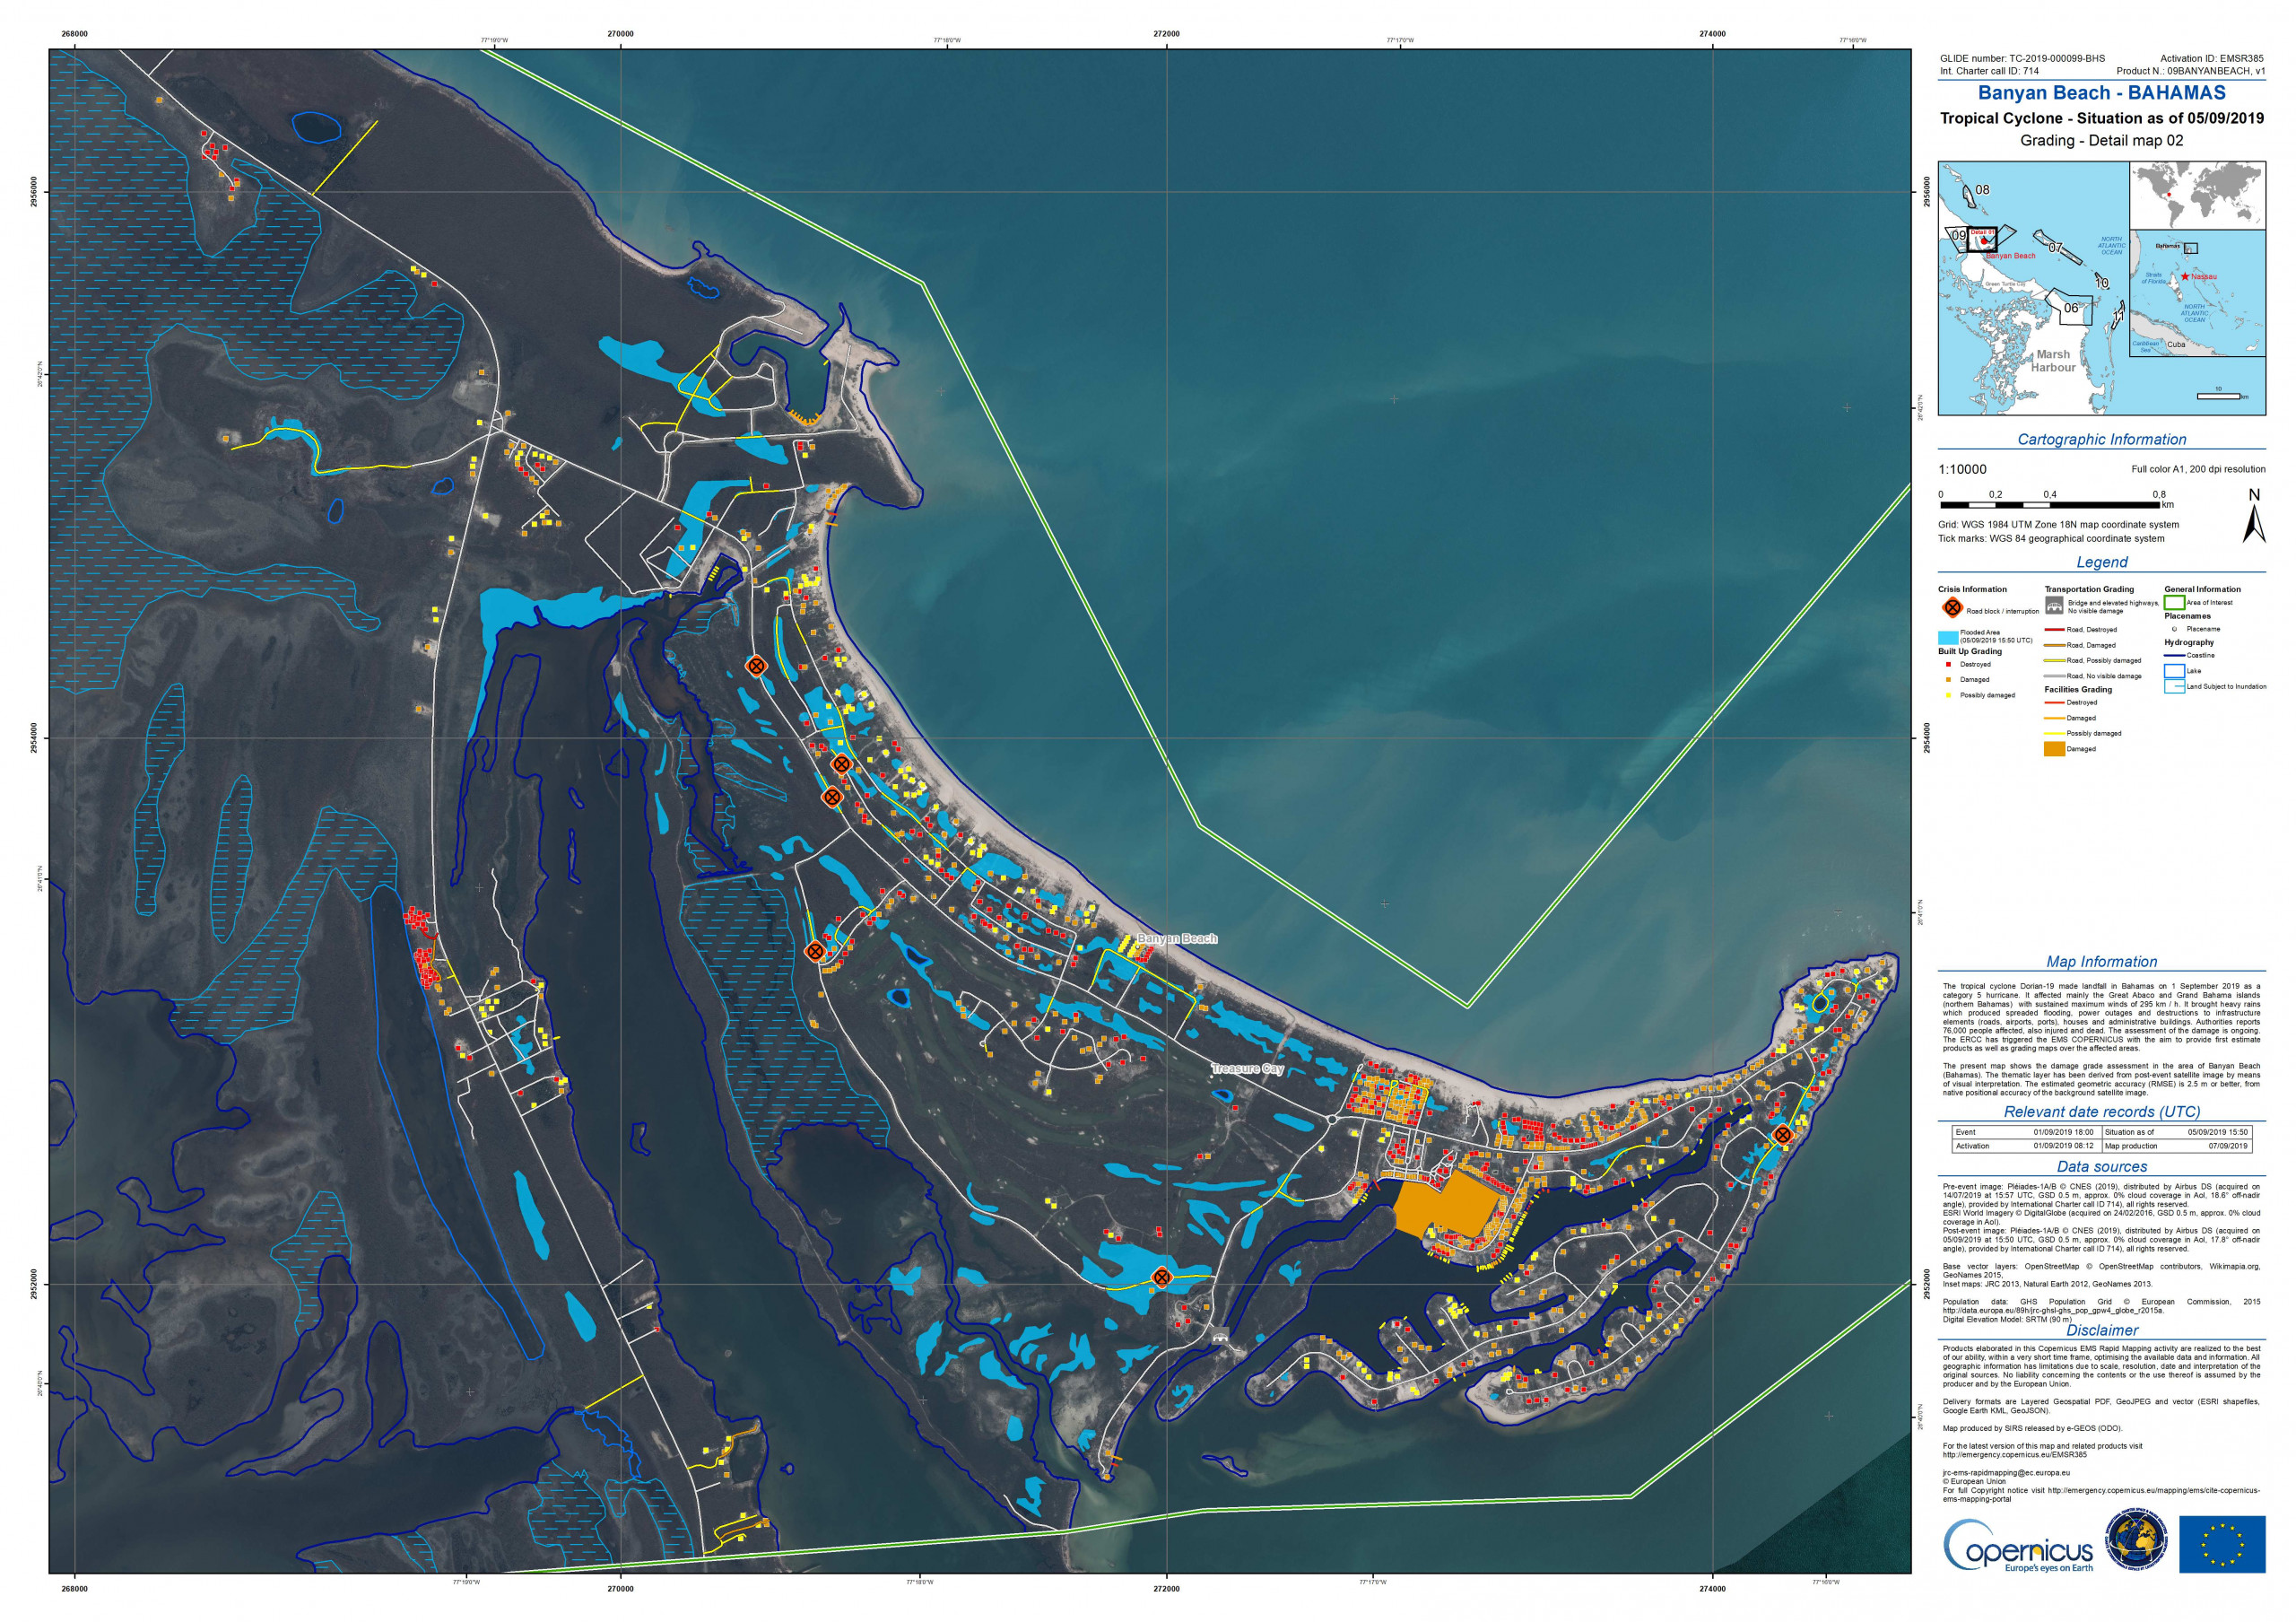
Rapid Mapping consists of the on-demand provision of geospatial information within hours or days from the activation in support of emergency management activities immediately following a disaster. Here is an example of Copernicus Emergency Management Service – Rapid Mapping from Hurricane Dorian. See original file: https://emergency.copernicus.eu/mapping/list-of-components/EMSR385
An international consortium to support disaster management
SIRS is a production site and part of a consortium of seven international partners led by e-GEOS and including also GAF, ITHACA, SERTIT, GMV and TPZ-IB that has been providing this service to the European Union since 2012, in the frame of a contract awarded by the European Commission’s Joint Research Centre.
SIRS expertise includes processing of SAR and optical imagery for extracting relevant and up-to-date information linked to the event (reference assets, delineation of affected areas, damage assessment).
More information and downloadable products on the web portal:
https://emergency.copernicus.eu/mapping/list-of-components/EMSR385
Please read the full story at:
https://www.aviso.altimetry.fr/en/applications/atmosphere-wind-and-waves/hurricanes/dorian-2019.html
SAR imagery credits:
*Public funds to provide RadarSat-2 imagery come from the Ministère de l’Education Nationale, de l’Enseignement Supérieur et de la Recherche, FEDER, Région Bretagne, Conseil Général du Finistère, Brest Métropole and by Institut Mines Télécom.
Title photo credit: Contains modified Copernicus Sentinel data (2019) routinely used by the SHOC team.
Related Posts:
 New step for the Indonesian Maritime Meteorological System (MMS1) delivered by CLS and its partners : High Performance Computing is now operational at BMKG HQ
 CLS, Data Partner for Our Planet Ocean
 CLS’ Water Platform: Digitizing Water Resilience