← Back
What European satellites reveal about Australia’s tropical cyclones

In March 2019, twin cyclones hit Australia. Tropical cyclone Trevor made landfall on Australia’s northern coast on March 23rd, bringing torrential rains and winds of up to 230km/h. Just two days later, another tropical cyclone, called Veronica, hovered off Australia’s northwest coast, causing heavy rainfall, large waves, and extensive flooding. From 700 km above, European Earth Observation satellites tracked the twin cyclones. CLS Group – and its partners – used data from these satellites to provide insight into these storms, before and after they hit.
BEFORE
Animation displaying the wind field derived from the Sentinel-1 SAR in dual-polarisation acquired over Tropical Cyclone Veronica while approaching Australian coast. Copernicus Sentinel-1A and Copernicus Sentinel-1B data were used to produce the animation. Maximum measured wind speeds reach more than 50m/s.
Copyright: Contains modified Copernicus Sentinel data (2019) The SAR images and wind maps are available for viewing on the EODA Portal, under the SHOC demo: eoda.cls.fr
Since 2016, experts from IFREMER and CLS have organized, in collaboration with the European Space Agency (ESA), a campaign called SHOC (Satellite Hurricane Observation Campaign), in order to gather extreme wind observations from European spaceborne sensors. In collaboration with space agencies and meteorological institutes, IFREMER and CLS experts are able to track the paths of cyclones and other storms and characterize the associated ocean surface wind speed.
Tracking cyclones by satellite
The IFREMER/CLS team uses Copernicus data along with other higher resolution data from multiple commercial providers to deliver the highest measurement accuracy.
To do this, precise track forecasts available from World Meteorological Organisation (WMO) Regional Specialised Meteorological Centre are provided by IFREMER/CLS to ESA’s mission planning team when a cyclone starts to materialize. In return, ESA identifies and plans the most suitable Sentinel-1 observations intersecting the expected location of the hurricane’s eye over the next 5 days. Depending on both the evolution and duration of the phenomenon, updates on track forecasts are expected every 3 days and, consequently, the planning loop is repeated to capture the new trajectory. This strategy enables the team’s experts following hurricanes throughout their entire lifespan (from Category 1 and above), thanks to dedicated “late-programmed” Sentinel-1 acquisitions by ESA’s Mission Planning team.
Precise wind speed measurements from space
In the case of Trevor and Veronica, Ifremer transferred wind speed measurements to Australia’s Bureau of Meteorology. SAR wind speeds measured reached up to 50 m/s, which is slightly higher than what Australian meteorologists had analyzed using several existing measurements.
Having access to SAR that provides high resolution surface winds that are accurate at all intensities will boost the ability to estimate the intensity and size of stronger cyclones. This will lead to improved forecasts including storm surge forecasts that are heavily reliant upon intensity and size. In the case of Veronica, the SAR data provided confidence that the cyclone was as strong as our operational estimates at some stages, but for one pass SAR was higher than we expected. This presents a challenge, as if this verifies to be valid, it would make forecasters rethink the skill of traditional techniques and result in a higher intensity when it was close to the coast. Ideally this data could be available in real-time to be of greater help in the operational environment.
AFTER
In the aftermath of Trevor and Veronica, European satellites were again mobilized to monitor flooding and assess the extent of the disaster. In this case, SIRS experts identified more than 80 km² of potentially flooded areas in the areas requested by the users.
Identifying impacted areas
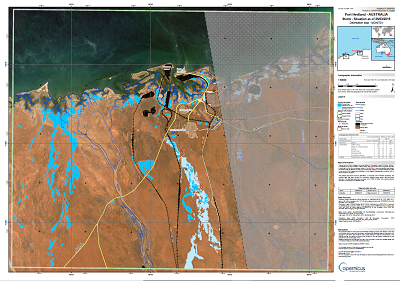
Rapid Mapping product generated by SIRS. The present map shows the flood delineation in the area of Port Hedland (Australia). The thematic layer has been derived from post-event radar satellite imagery using a semi-automatic approach.
For more information: Copernicus Emergency Management Service (© 2019 European Union).
Data was made available to the Australian Delegation of the European External Action Service (EEAS) and Geoscience Australia which is the pre-eminent public sector geoscience organisation. The potential purposes are to plan evacuation routes, evaluate the extent of infrastructure damage and understand road conditions in order to keep residents safe.
More than 2,000 people were evacuated from the Northwest Territory due to cyclone Trevor.
This is not the first time that Australian authorities request for support from Copernicus EMS and they appreciate the near-real time, geospatial analytical products prepared by the Copernicus operation centers in Europe.
How it works
Following a request from Geoscience Australia the European Emergency Response Coordination Centre (ERCC) activated Copernicus Emergency Management Service – Rapid Mapping, a service of the European Union’s Earth Observation programme Copernicus which uses satellite imagery and other geospatial data to provide free of charge information on natural disasters, human-made emergencies and humanitarian crises worldwide.
Teams from CLS Group subsidiary, SIRS, worked from Sunday, March 24th-27th to provide Rapid Mapping services on the Australian provinces impacted by the storms.
Rapid Mapping consists of the on-demand provision of geospatial information within hours or days from the activation in support of emergency management activities immediately following a disaster. The maps provided to the Australian authorities are designed to provide information to help authorities on the ground to assess the geographical extent of the event (delineation maps).
An international consortium
SIRS is a production site and part of a consortium of five international partners led by e-GEOS and includes GAF, ITHACA, SERTIT that has been providing this service to the European Union since 2012, in the frame of a contract awarded by the European Commission’s Joint Research Centre.
SIRS expertise includes processing of SAR and optical imagery for extracting relevant and up-to-date information linked to the event (reference assets, delineation of affected areas, damage assessment).
Learn more
The maps and vector data are available for viewing and download on the EMS Portal: EMSR350: Trevor and Veronica tropical cyclones in Northern Australia
Top of article, photo credit: Contains modified Copernicus Sentinel data (2019) / Contains NOAA operational best-track analysis
Related Posts:
 New step for the Indonesian Maritime Meteorological System (MMS1) delivered by CLS and its partners : High Performance Computing is now operational at BMKG HQ
 CLS, Data Partner for Our Planet Ocean
 CLS’ Water Platform: Digitizing Water Resilience