With Sentinel -1 and CLS expertise, we have the opportunity to observe the Earth and get radar images of any place in the world to monitor the maritime space, detect oil slicks, help track vessels, fight against illegal trafficking (illegal fishing, piracy, etc.), understand ocean evolution, monitor ground motion and support authorities in case of natural disasters.
Sentinel S1-A reveals Nepal quake movement
The launch of the European satellite Sentinel -1A in April 2014, as part of the Copernicus programme led by the European Union and the European Space Agency (ESA), enables to provide accurate measurements of Earth’s observation. Sentinel is an open and collaborative data programme designed for users whether institutional, scientific or private. One of its most important objectives is to provide rapid response to natural disasters. As a recent example, Sentinel has allowed quickly measuring the ground displacement caused the Nepal earthquake that took place on April 25.
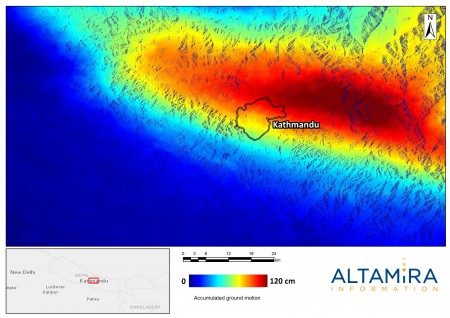
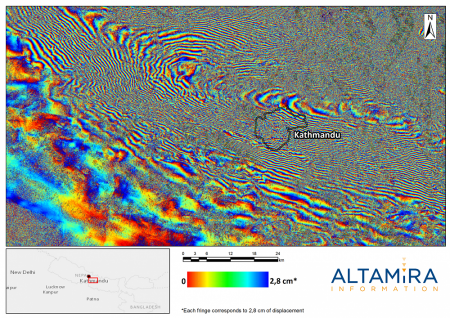
Interferogram and ground motion map of the Nepal earthquake
The interferogram shows “fringes” (complete cycles of colour) each of which represents around 3 cm of deformation. The great number of fringes provides an idea of the destructive nature of the event that has caused motion of about 1m in the ground around Kathmandu.
Satellite images allow scientists to detect ground motion with millimetric precision. “We acquire an image prior to the earthquake covering the area of interest and another image taken after the event. Then, we apply a series of algorithms and generate an interferogram, which is a technical representation of the fault’s displacement, like a curve map that shows the level of motion”, explains Maite García, Communication Manager at Altamira Information, a CLS Group company based in Barcelona and specialised in processing and analysing satellite images in order to measure ground motion on the Earth’s surface. “In emergency situations, when a natural disaster occurs, we produce an interferogram that we quickly put at Copernicus’ disposal, the European Earth Observation Programme. Copernicus, among other services, provides maps created from satellite data in emergency situations, such as natural disasters”, details Maite García.
This map represents the accumulated motion in the area and shows the devastating aftermath of the quake. The colour legend indicates different intensity of motion. Areas in blue are stable, yellow areas represent motion of less than 1m and red indicates the most affected areas, including Kathmandu, where motion reached more than 1m.
Once the interferogram has been generated, Altamira Information prepares a ground motion map of the Nepal earthquake that clearly shows the ground motion rates affecting every area. These maps allow for the precise discovery of which parts of the fault slid, which did not and, most importantly, which ones could unleash a new earthquake, although determining exactly when this will happen is not yet possible.
Showcase map – This map illustrates how space-based ground motion measurements contribute to the study of vulnerability associated to natural and man-made hazards, such as the deformation caused by earthquakes, coastal erosion, intensive exploitation of aquifers, or tunnelling in urban areas.
Take preventive measures in case of natural disasters
In the case of Nepal, thousands of landslides are likely to have been triggered by the earthquake due to the steep topography of the area of the epicentre and the high intensity of the shaking. In this regard, motion maps offer valuable information to experts in order to improve the models that may determine which areas will be the most vulnerable to landslides.
With the second earthquake, the entire process was repeated. “When we arrived at the office on Tuesday, we already knew, via Twitter and the news that a second earthquake had struck Nepal. Our technical team immediately started working in order to generate information that could be of help.”, explains García.
The interferograms are not only useful in case of earthquakes, but in all types of natural disasters, from erupting volcanoes to floods. One of the latest projects carried out by Altamira Information was for the World Bank, part of the United Nations. “In overpopulated cities, like Jakarta, the capital of Indonesia, located on the coast, water resources are overexploited. This overexploitation results in ground displacement, which makes these cities more and more vulnerable to any potential disaster, such as floods”, says Garcia. In these cases also, the maps generated from satellite radar images are absolutely necessary to help take preventive measures.


